The latest Eurostat report on AI adoption in EU enterprises provides a comprehensive look at how businesses across different sectors and countries are leveraging these technologies. In this blog post, we’ll explore the key findings from the report, highlighting the adoption rates, types of AI technologies used, and the geographical differences in AI usage.
Significant AI Adoption Rates in 2023
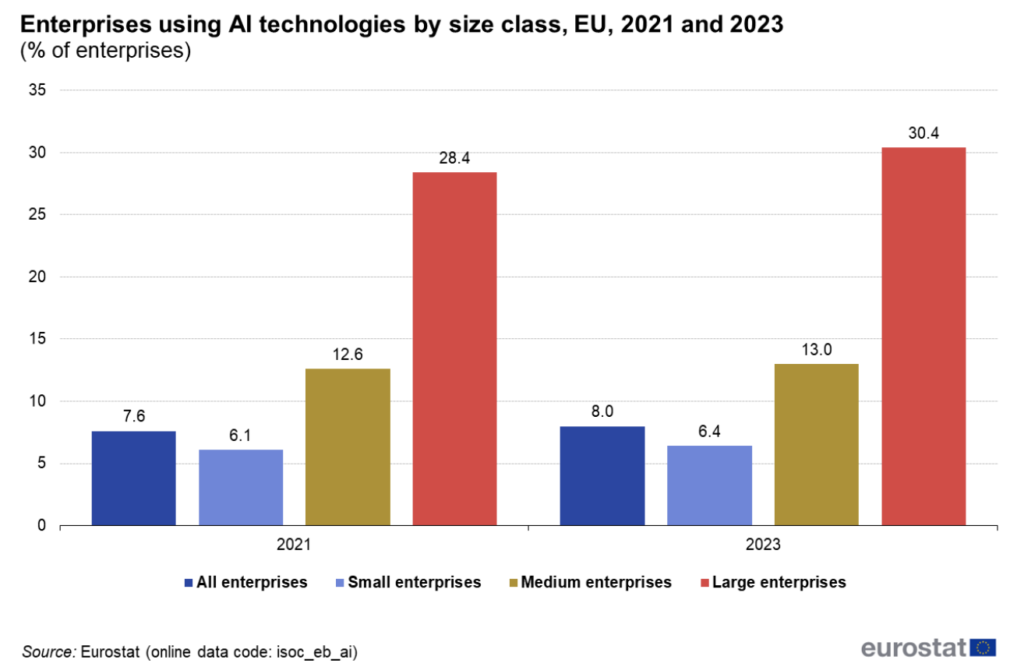
In 2023, 8% of EU enterprises with 10 or more employees reported using AI technologies. This marks a slight increase from previous years, reflecting the growing recognition of AI’s potential benefits.
Notably, large enterprises are leading the way, with a 30.4% adoption rate, compared to 13% of medium-sized enterprises and 6.4% of small enterprises (Figure 01). This disparity highlights the challenges smaller companies face in implementing AI, such as complexity and cost.
Sectoral Adoption of AI
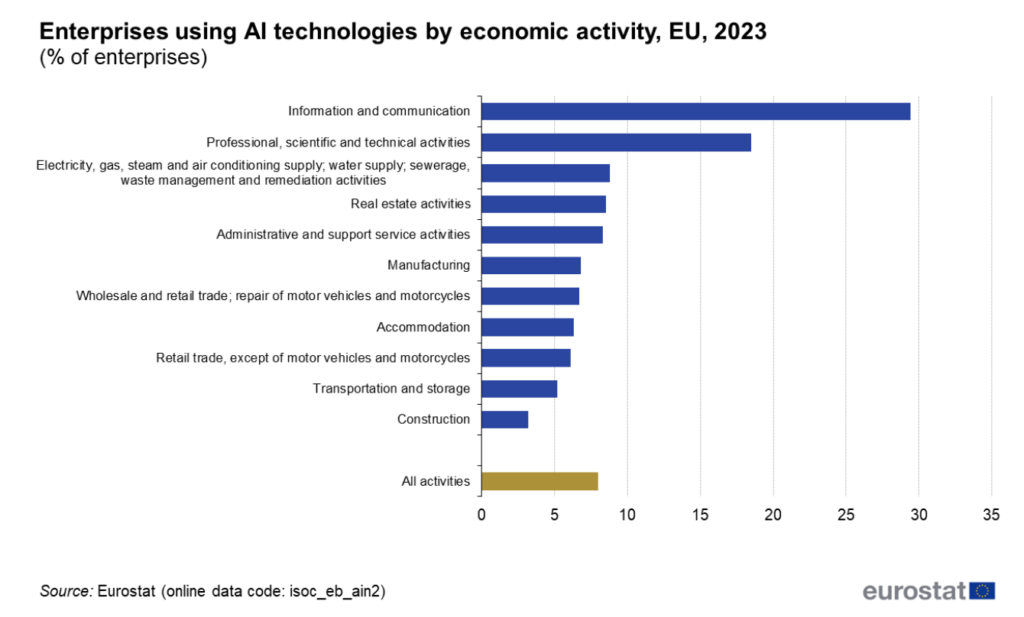
AI adoption varies significantly across different sectors. The information and communication sector is at the forefront, with 29.4% of enterprises using AI. This is followed by professional, scientific, and technical services, where 18.5% of businesses have integrated AI technologies (Figure 02). These sectors are likely leveraging AI for tasks such as data analysis, workflow automation, and enhancing decision-making processes.
Types of AI Technologies Used
EU enterprises employ a variety of AI technologies to meet their specific needs. The most commonly used technologies in 2023 include:
- Automation & Decision-Making Tools: 3% of enterprises use AI for automating workflows and assisting in decision-making.
- Text Mining: 2.9% use technologies for analyzing written language.
- Machine Learning: 2.6% utilize machine learning for data analysis.
- Speech Recognition: 2.4% convert spoken language into machine-readable formats.
- Image Recognition: 2.3% use image processing technologies.
- Natural Language Generation: 2.1% generate written or spoken language using AI.
- Autonomous Machines: Less than 1% use technologies that enable machines to move and make decisions autonomously.
Geographical Differences in AI Adoption
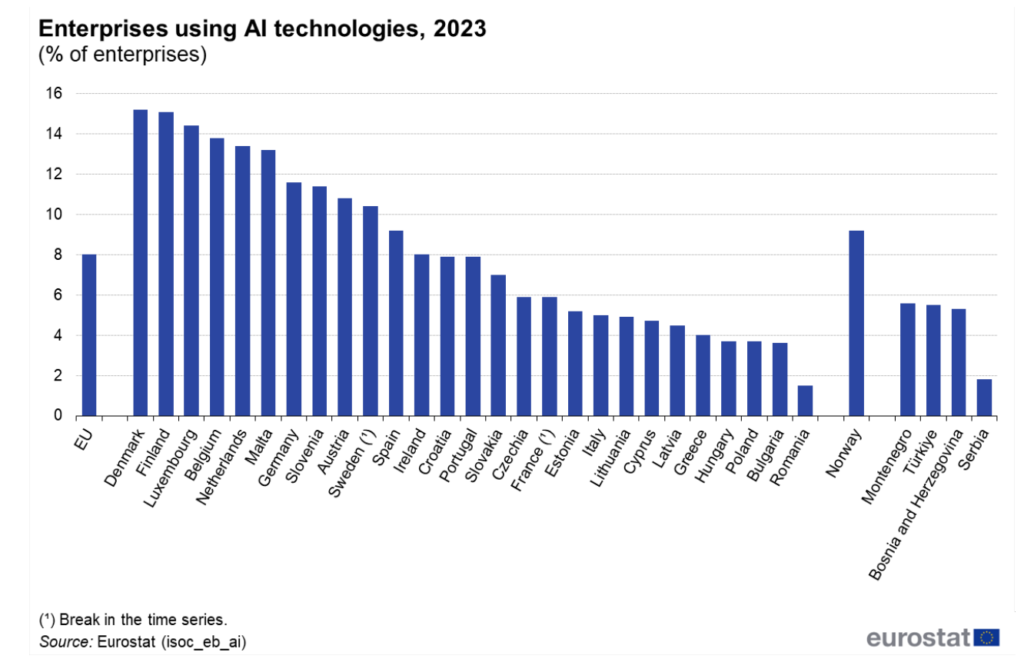
AI adoption also varies across EU countries, as we can observe on Figure 03. Denmark leads the pack with a 15.2% adoption rate, followed closely by Finland at 15.1% and Luxembourg at 14.4%. On the other end of the spectrum, Romania, Bulgaria, and Poland show lower adoption rates at 1.5%, 3.6%, and 3.7% respectively. These differences could be attributed to varying levels of digital infrastructure, investment in AI technologies, and sectoral focus within these countries.
Final Thoughts
The Eurostat report highlights the growing importance of AI across different sectors and countries within the EU. Large enterprises and certain sectors, such as information and communication, are leading the charge in AI adoption. However, there is still significant room for growth, especially among small enterprises and in countries with lower adoption rates.
Before selecting a tool or implementing any AI solution, it is crucial to understand the technology: its potential, limitations, and possibilities. This understanding is the foundation of successful AI integration. We recognize the transformative power of AI and are dedicated to guiding businesses through this intricate landscape. Whether you are aiming to implement AI technologies, develop a robust strategy, or enhance your team’s skills, we are here to support you every step of the way.
Contact us today to discover how we can help you harness the potential of AI, optimize your operations, and drive innovation. Together, let’s shape a future where AI enhances every aspect of your business!
Sources
[1] AGORIA: Les entreprises belges à la pointe en matière d’utilisation de l’IA
[2] EUROSTAT: Statistics Explained (https://ec.europa.eu/eurostat/statisticsexplained/)